Simple Leaflet Map, unique values color.
Working Map
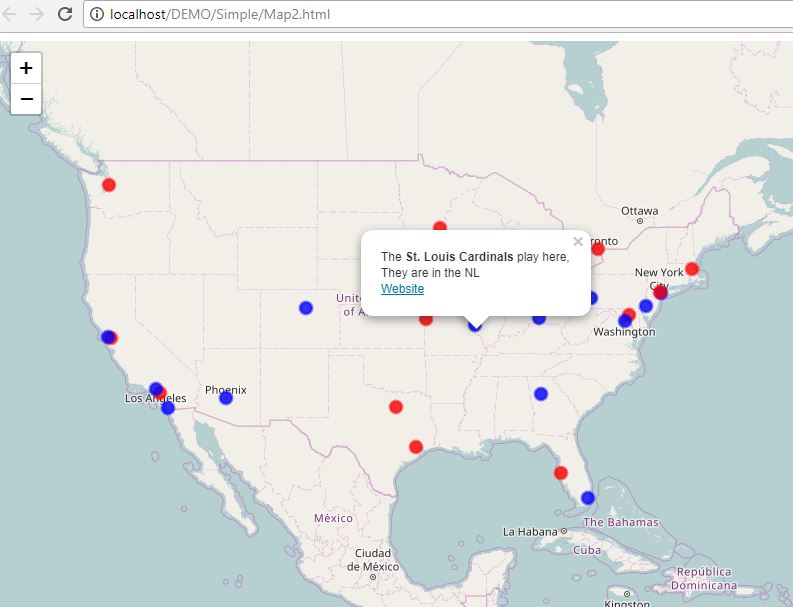
This is a simple Leaflet map using a static GeoJSON file (BaseBallFinal.json) I use JQuery's getJSON function to read the file. I start with the basic map view and basemap, here I use osm (OpenStreetMap), define what the layer is going to look like, I chose circleMarker, and define the popup format and data. Last I read the GeoJSON file and add the data to the layer. This map is similar to my first map but now I have extra code to define colors for the circleMarker.
Now the code.
In the head section, I have the list of libraries I used, basically Leaflet, JQuery, and JQuery UI (User Interface), both the JavaScript and CSS files.
<!DOCTYPE html>
<html>
<head>
	<title>GeoJSON tutorial - Leaflet</title>

	<link rel="stylesheet" href="https://unpkg.com/leaflet@1.0.3/dist/leaflet.css" />
	<script src="https://unpkg.com/leaflet@1.0.3/dist/leaflet.js"></script>
    <script src="https://ajax.googleapis.com/ajax/libs/jquery/2.2.0/jquery.min.js"></script>
Now the CSS information. This only a map but here you define the height and width in pixals.
<style>
		#map {
			width: 800px;
			height: 600px;
		}
</style>
Define the div for the map. Now the data, here I define the GeoJSON file. It's a static file instead of a web service (REST) feed. Since this data won't change this method saves on server processing.
</head>
<body>
<div id="map" >
</div>
<script>

var url = 'BaseBallFinal.json';  // my GeoJSON data source, in the same folder as my HTML file.
Now I need to define the base map.
The map is declared with the center and zoom level set for the US.
I'm using OpenStreetMap as the basemap, it's a very clean popular map.
	var map = L.map('map').setView([37.52715,-96.877441], 4);

	var osm=new L.tileLayer('http://{s}.tile.osm.org/{z}/{x}/{y}.png',{
				attribution: '© <a href="http://osm.org/copyright">OpenStreetMap</a> contributors'});
Since I'm using circleMarkers, I have to define how they look. Most of the symbology is defined when I'm defining the layer further in the code. The getColor function here reads the past value for League from the GeoJSON file and if it has the value 'NL' use blue as the color and 'AL' gets red. Anything else gets a white color making it easy to find the feature with a typo or missing data error.
	// Set function for color ramp
	function getColor(league){
		return league == 'NL' ? 'blue' :
			  league == 'AL' ? 'red' :
				'white';
	       }
The forEachFeature function stays the same as it did in the first map. It's just defining the popup template with a hyperlink, bound to to each feature.
	function forEachFeature(feature, layer) {

			var popupContent = "<p>The <b>" +
					feature.properties.Team + "</b> play here,</br> They are in the " +
					feature.properties.League + "</br>" +
					'<a href="'+ feature.properties.Website +'" target="_blank">Website</a></p>' ;

			if (feature.properties && feature.properties.popupContent) {
				popupContent += feature.properties.popupContent;
			}
				layer.bindPopup(popupContent);
	};
Now I'm ready to define the layer. I'm calling it bbTeam and the null means not data source yet, however it should use the forEachFeature function for the onEachFeature option.
The pointToLayer is a function that converts the data to points, and for every feature retun a circleMarker at that location using the options below. Notice I use a getColor function to define what color which depends on the value defined in the Laegue field of the GeoJSOn data.
  var bbTeam = L.geoJSON(null, {
			onEachFeature: forEachFeature,
			pointToLayer: function (feature, latlng) {
				return L.circleMarker(latlng, {
					radius:6,
					opacity: .5,
					//color: "#000",
					color:getColor(feature.properties.League),
					fillColor:  getColor(feature.properties.League),
					fillOpacity: 0.8

				}).bindTooltip(feature.properties.Name);

			}
	  });
Next using the JQuery getJSON function, read the data at the url location, pass it to the function as data, and add it to the layer. Finally add the layer to the map.
  	// Get GeoJSON data and create features.
	$.getJSON(url, function(data) {
		bbTeam.addData(data);
	});

	bbTeam.addTo(map);
That is it, toss in some closing tags and I am done.
My finished script,
My GeoJSON data
</script>
</body>
</html>